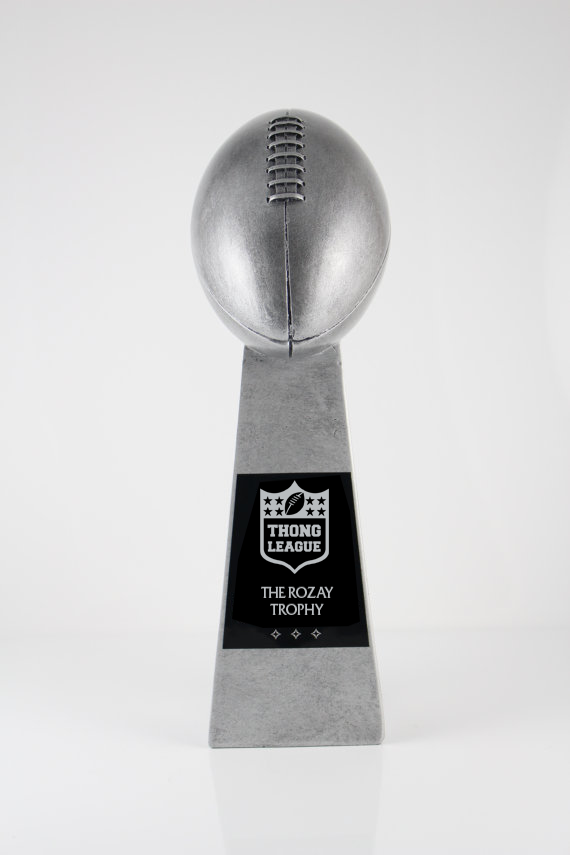
 Champions
| Year | Champion |
 Shaft Shaft |
 Thong Thong |
|---|
| Manager | S | W | L | T | G | W% | PF | PA | PPG | Avg Fin | CA | TBA | Rings | Thongs |
|---|
| # | Manager | W | L | T | PF | PPG | DIFF |
|---|
How it works: Each week, your expected wins = the fraction of other teams' scores you would have beaten. Luck = actual wins − expected wins. Positive = lucky schedule; negative = unlucky.
| Manager | Year | Actual W | Exp W | Luck |
|---|
| # | Player | Pos | Starts | Total Pts | PPG | Most Started By |
|---|
Game records cover every regular-season game, (official ESPN scores).
| # | Points | Manager | Week |
|---|
| # | Points | Manager | Week |
|---|
| # | PF | PPG | Manager | Year |
|---|
| # | PF | PPG | Manager | Year |
|---|
| # | MOV | Winner | Score | Loser | Week |
|---|
| # | MOV | Winner | Score | Loser | Week |
|---|
| # | Combined | Winner | Score | Loser | Week |
|---|
| # | Combined | Winner | Score | Loser | Week |
|---|
| Manager | Best W | Worst L |
|---|
| # | $Bid | Player | Pos | Manager | Year |
|---|
Average starting PPG of players grouped by auction bid amount (2019+ only, where we have actual performance data)
Each bar spans the 10th–90th percentile range. The dot marks the median score. Wider bars = more variance (boom-or-bust); narrower = consistent.
Do managers play better or worse when it counts? Only includes seasons where the manager finished in the top 4 (championship bracket). Consolation bracket games are excluded.
| Manager | RS W% | PO W% | RS Avg | PO Avg | Δ Avg |
|---|
Running total of all points scored each season. Shows who has contributed the most offense to the league over their career.
Each cell = points left on bench from suboptimal start/sit decisions that week. Lower is better — green means you made good calls.
| Manager | Bench Pts | Pts Left | vs Proj | Weeks |
|---|
Punishments last place wears the Thong